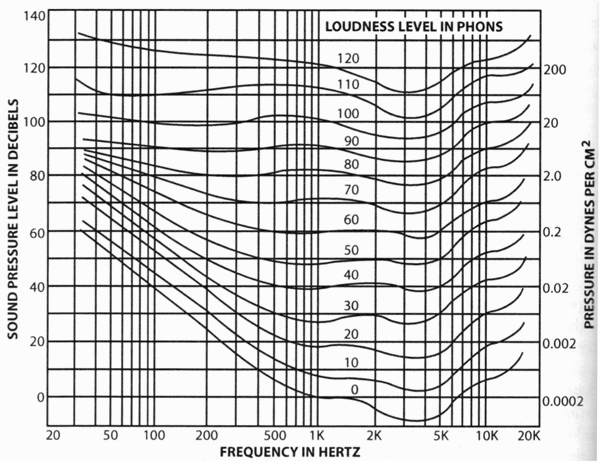
(n.) A graph that indicates the sensitivity of the average ear to different frequencies at different loudness levels. The X-axis shows frequency and the Y-axis shows sound pressure levels. The horizontal contours indicate the sound-pressure levels required to produce the same perceived loudness at different frequencies.